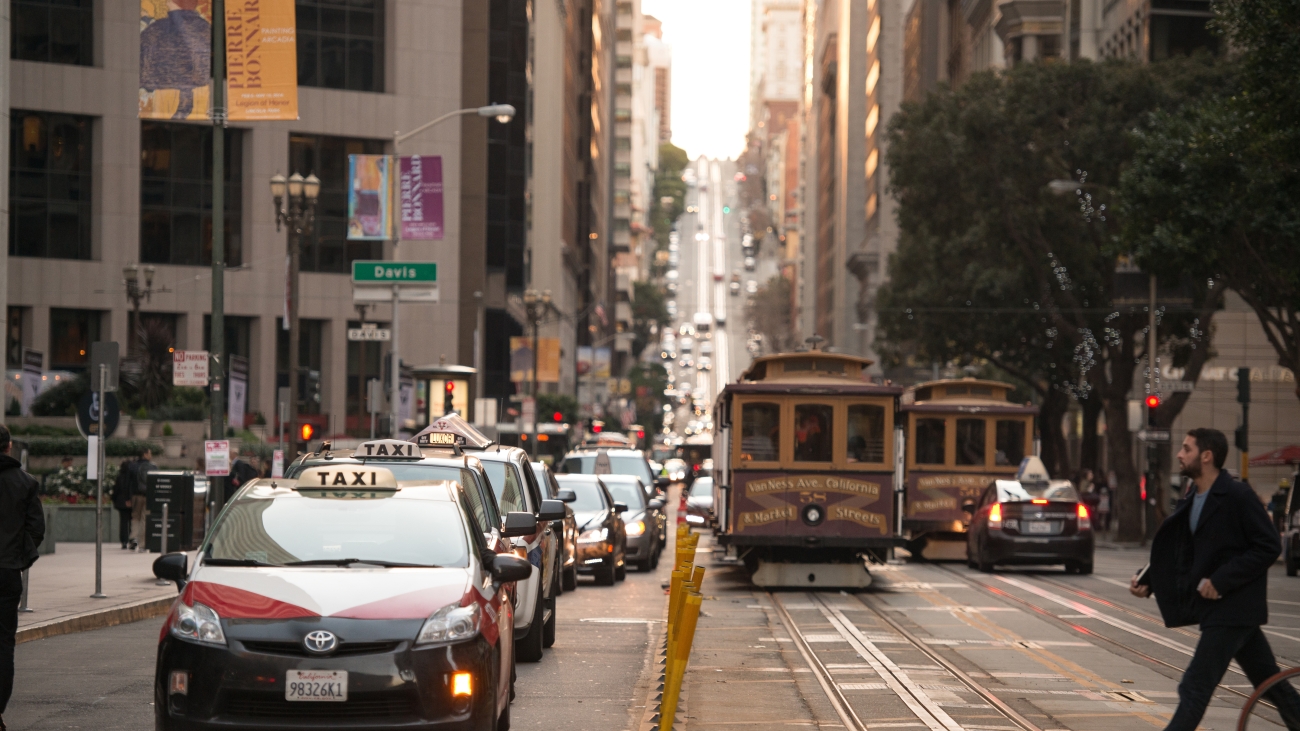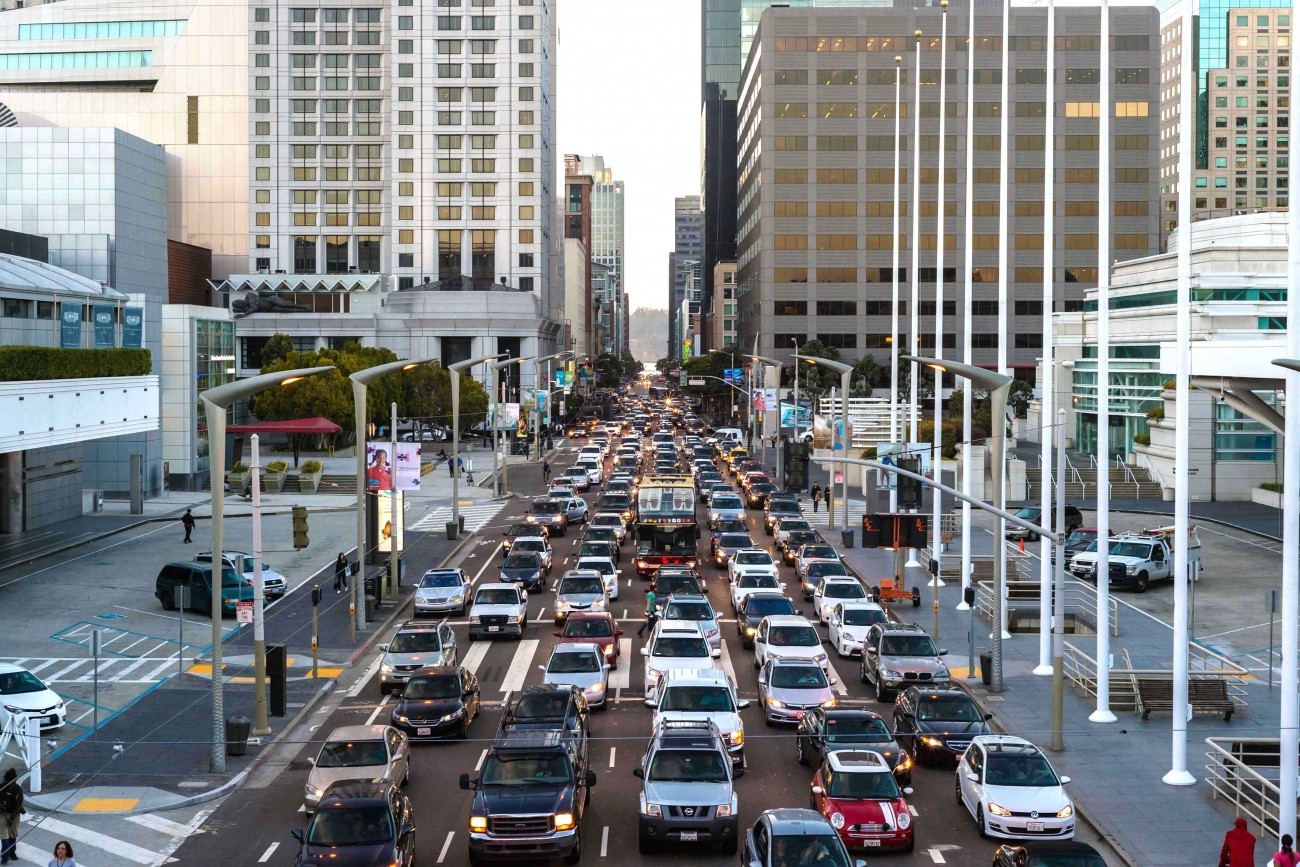
Photo by SFMTA Photography Department
As San Francisco reopens, recent data suggest a mixed rebound in economic activity, with steady bridge traffic and highway speeds, increased ridership on public transit relative to pre-pandemic levels, and workers slowly returning to offices.
In our role as San Francisco’s congestion management agency, we monitor congestion on the main arterials across the city. Our 2021 Congestion Management Program shows travel trends have been disrupted due to the pandemic's profound effect. As the city recovers, congestion has been returning to streets and freeways, in some cases to nearly pre-pandemic levels. Check out our Covid-Era Congestion Tracker for a week by week of how congestion has changed over the course of the pandemic.
Here are some highlights of key trends we’ve compiled with charts from SF Standard, SFMTA, and the SF Controller’s Office (PDF):
San Francisco bridge crossings almost match pre-pandemic levels
Chart: SF Standard; Source: Bay Area Toll Authority, Golden Gate Bridge Highway and Transportation District
Highway speeds match pre-pandemic speeds
Chart: SF Standard; Source: SFCTA
Muni ridership over 50% of pre-pandemic level
Source: SFMTA
BART ridership 33% of pre-pandemic level
Chart: SF Office of the Controller (PDF); Source: BART
Unemployment has dropped to pre-pandemic levels
Chart: SF Office of the Controller (PDF); Source: EDD
San Francisco workers returning steadily
Chart: SF Office of the Controller (PDF); Source: Kastle Systems
San Francisco half-cent sales tax for transportation shows rising revenues
Resources
- SF Office of the Controller Status of the Re-Opening of the San Francisco Economy: May 2022 (PDF)
- 2021 Congestion Management Program Final Report (PDF)
- SF Chamber of Commerce Economic Recovery Data Dashboard
- Track the Recovery
- SFMTA Transportation Recovery Plan Dashboards
- SFMTA Employer Resources: Welcome back to the office
- BART Ridership Reports


