Image
The study goal is to understand resident and worker transportation needs, outline recommended short-term public transit improvements, and plan for supplemental transportation options.
Image
The District 4 Mobility Study will explore ways to increase the use of non-automobile modes in the Outer Sunset and Parkside neighborhoods.
Image

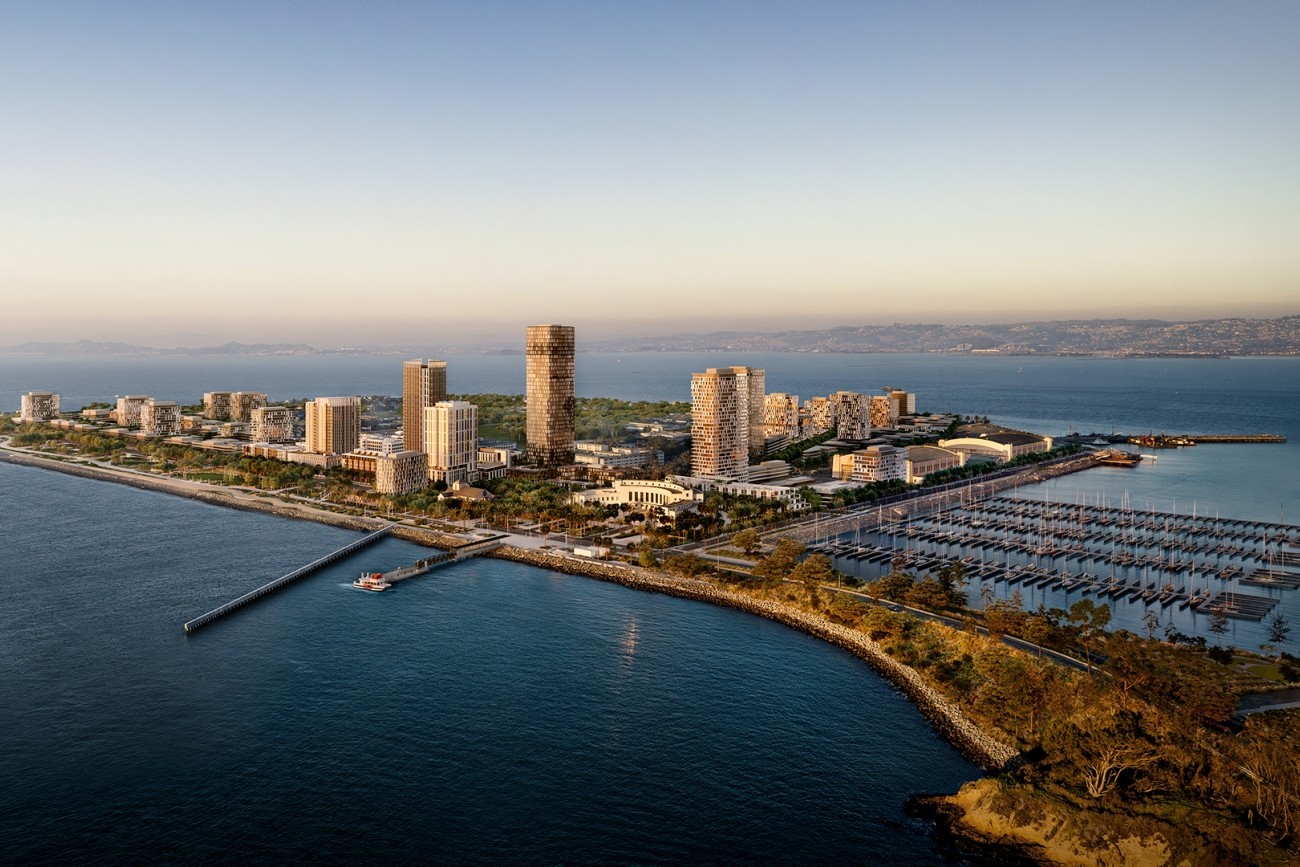
The Bimla Rhinehart Vista Point, previously named the Pier E-2 Phase 2 project, is part of the Toll Bridge Seismic Program in which the Bay Area Toll Authority and Caltrans repurposed the area in and around Pier E-2 at the base of the East Span of the Bay Bridge for public use.
Image

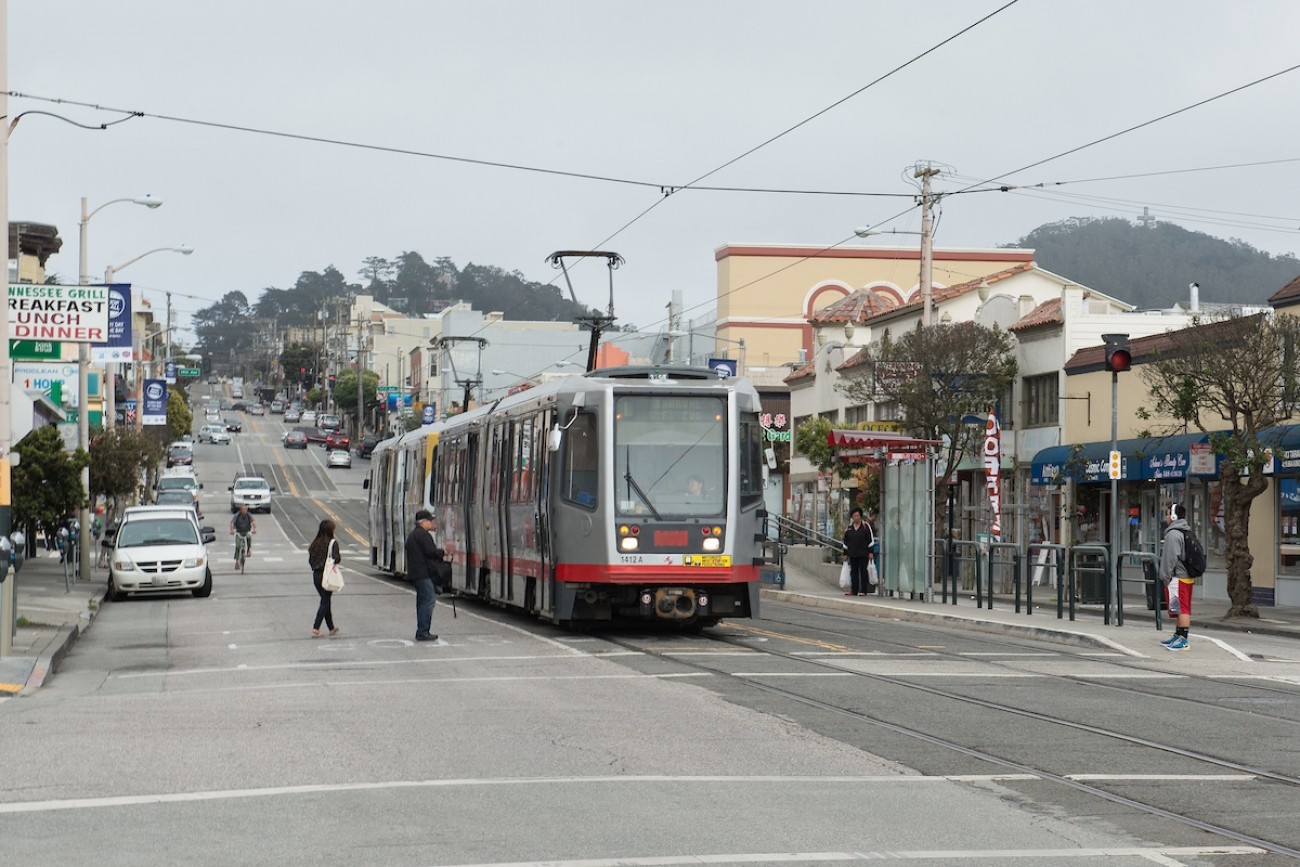
The Central Subway extends the Muni T-Third line north from Fourth and King streets, traveling mostly underground to Chinatown.
Image

The Ocean Ave Multi-Use Path Feasibility Study will determine the technical feasibility of creating Class 1 multi-use path improvements along Ocean Avenue between the I-280 southbound off-ramp intersection at Howth Street and the Frida Kahlo / Ocean / Geneva intersection.
Image
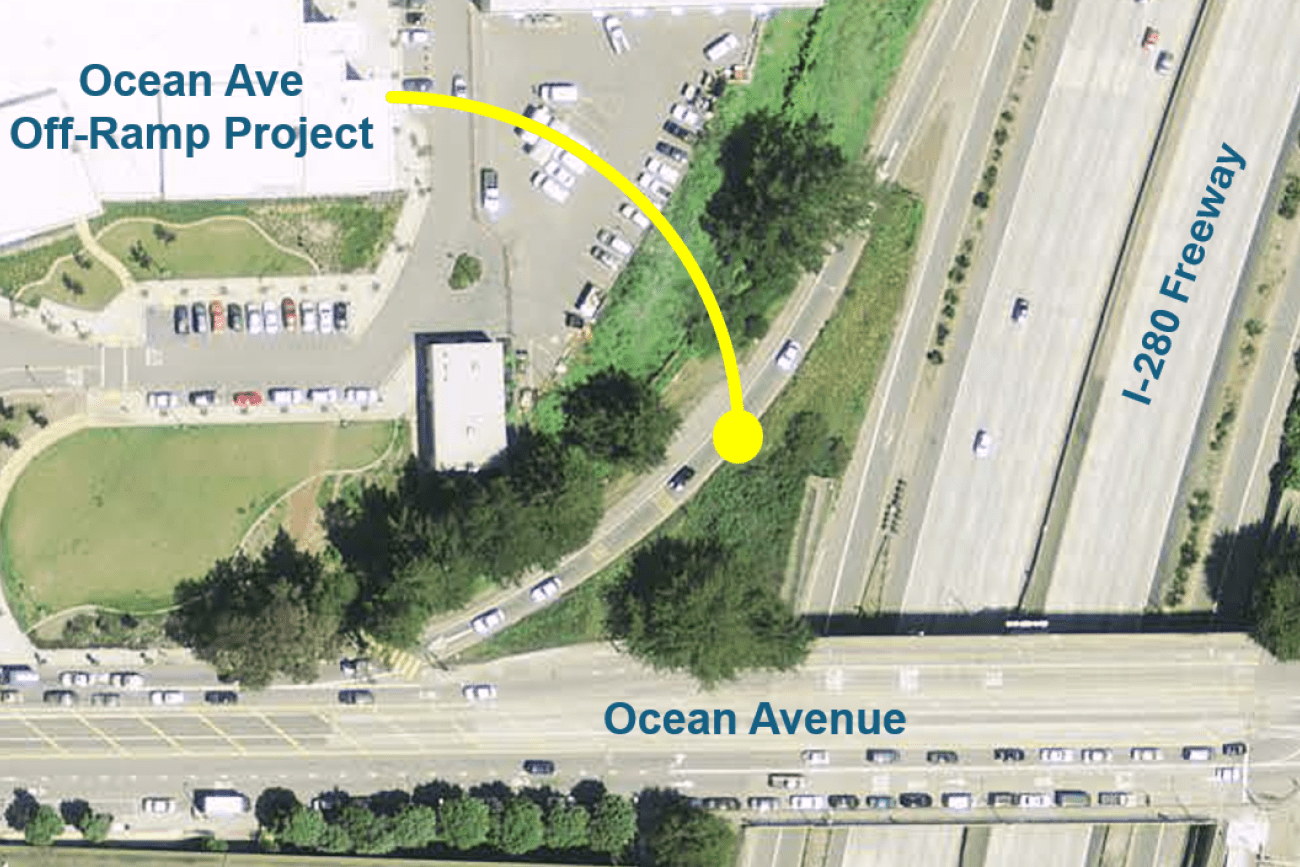
The project will improve pedestrian and bicyclist safety at the Ocean Avenue Off-Ramp intersection by realigning the free-flow right turn off-ramp into a signalized intersection and install a traffic signal.
Image
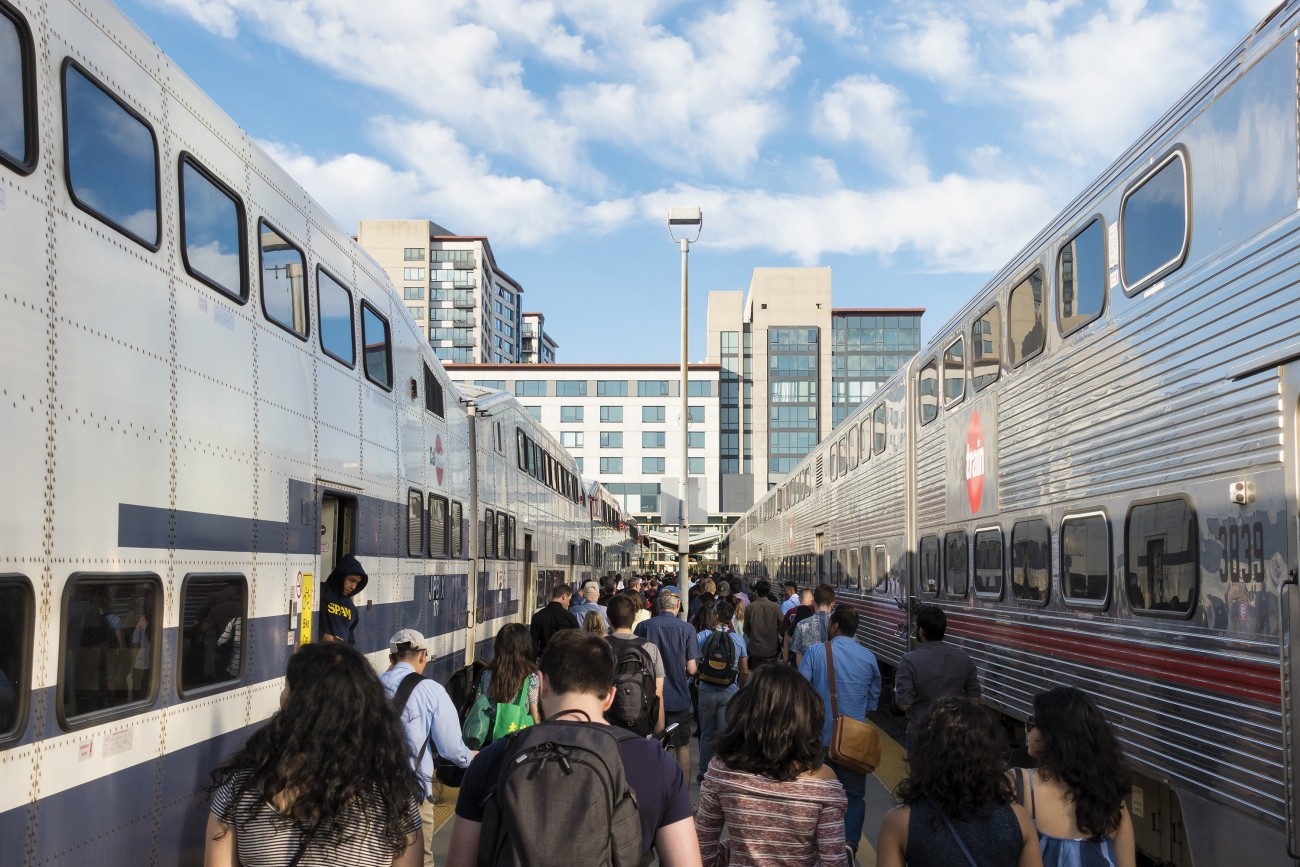
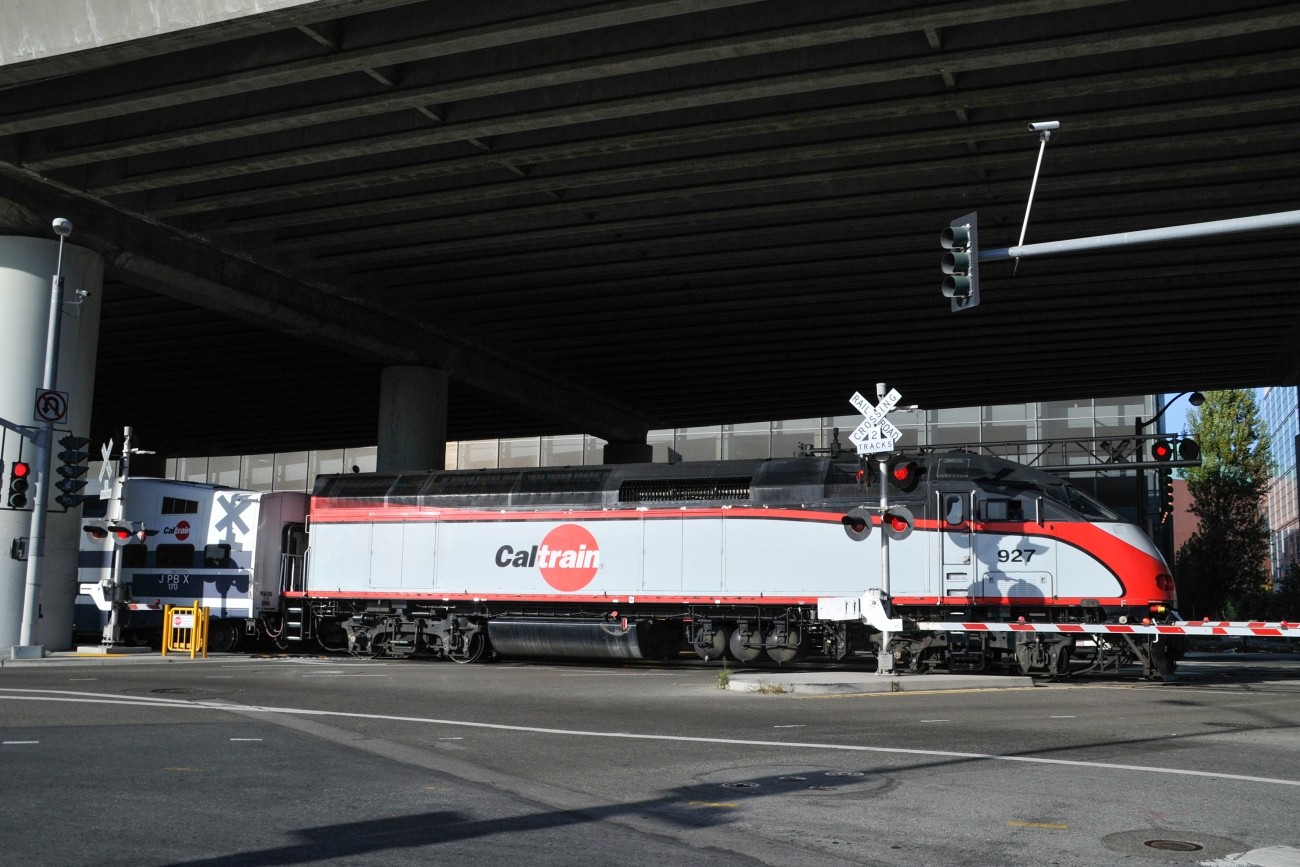
The Downtown Extension is a plan to extend Caltrain and future California High-Speed Rail service from 4th and King rail yard to the newly-constructed Salesforce Transit Center.
Image
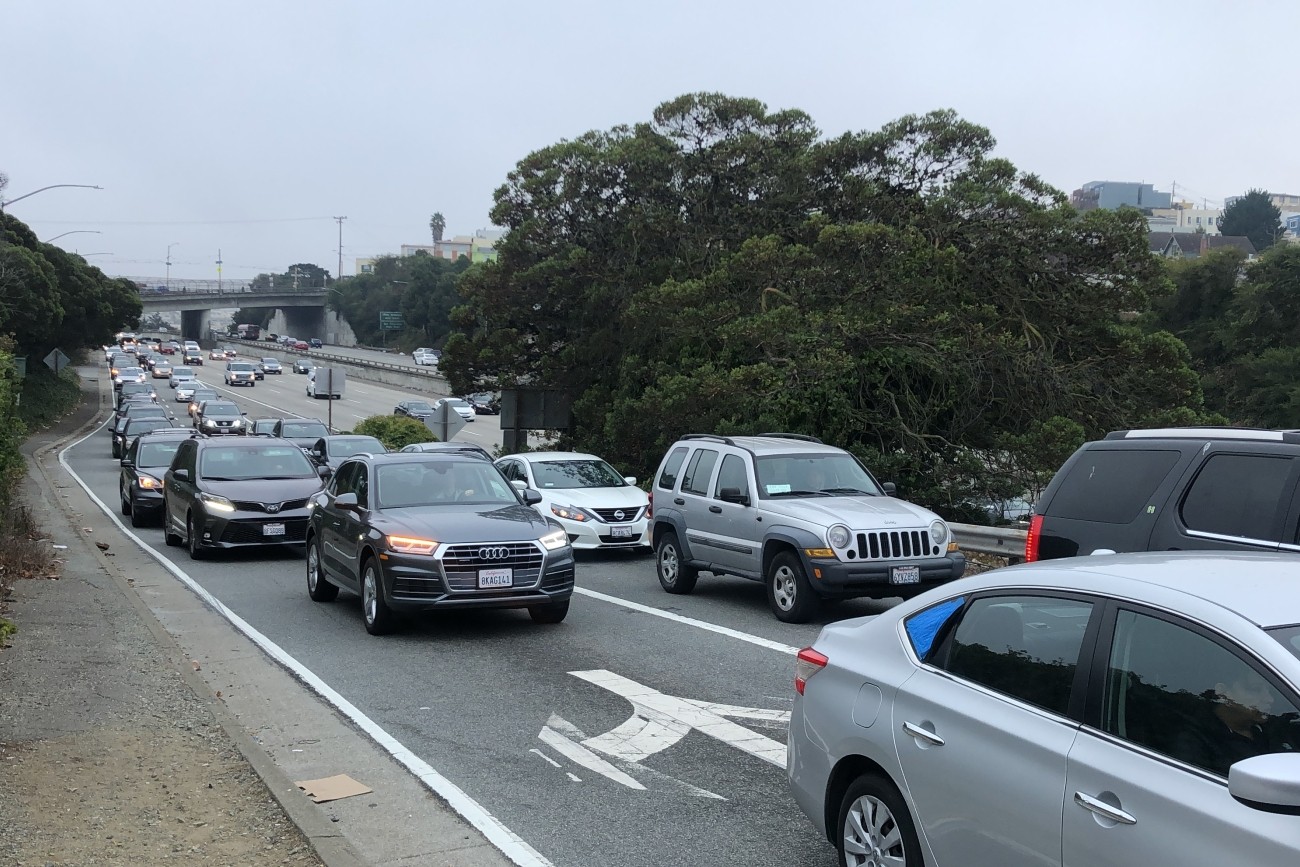
The primary objective of this study was to address safety issues at the I-280 northbound Geneva off-ramp including vehicle queues extending to the freeway mainline and related collisions. The study also explored ways to improve multimodal safety while maintaining essential transit and pedestrian movements in the area.
Image
The Pennsylvania Avenue Extension project will support future uninterrupted passenger rail service through San Francisco.
Image

The West Broadway Tunnel Safety Project will improve safety and reduce vehicle speeds at the west end of the Broadway Tunnel. The project will deliver a set of safety upgrades including changes to street markings, signage, traffic signals, and bike corrals along Broadway between Polk and Powell streets, while maintaining two travel lanes in each direction.
Image
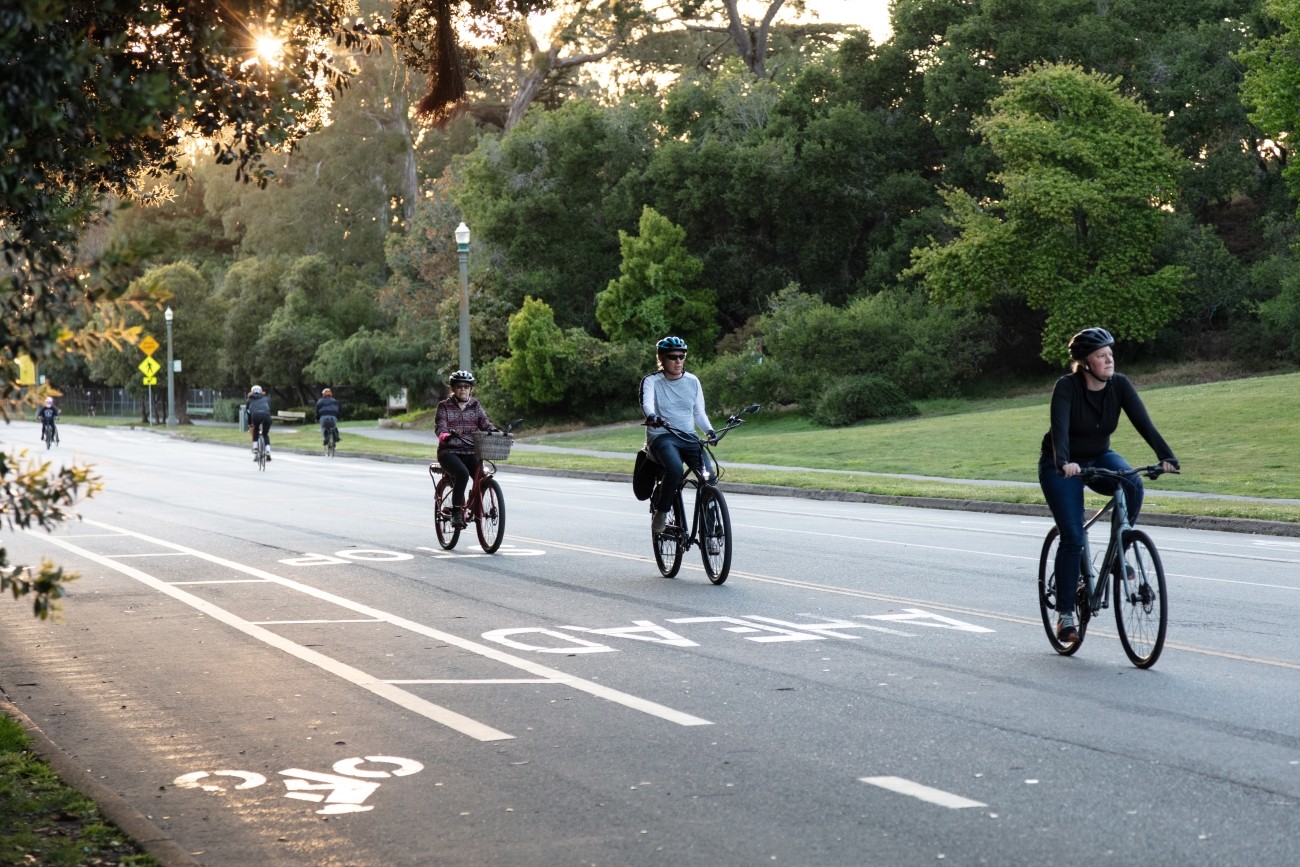
This study analyzes how people travel to the eastern portion of Golden Gate Park and what barriers exist to getting there, particularly for people living in Equity Priority Communities furthest from the park.
Image
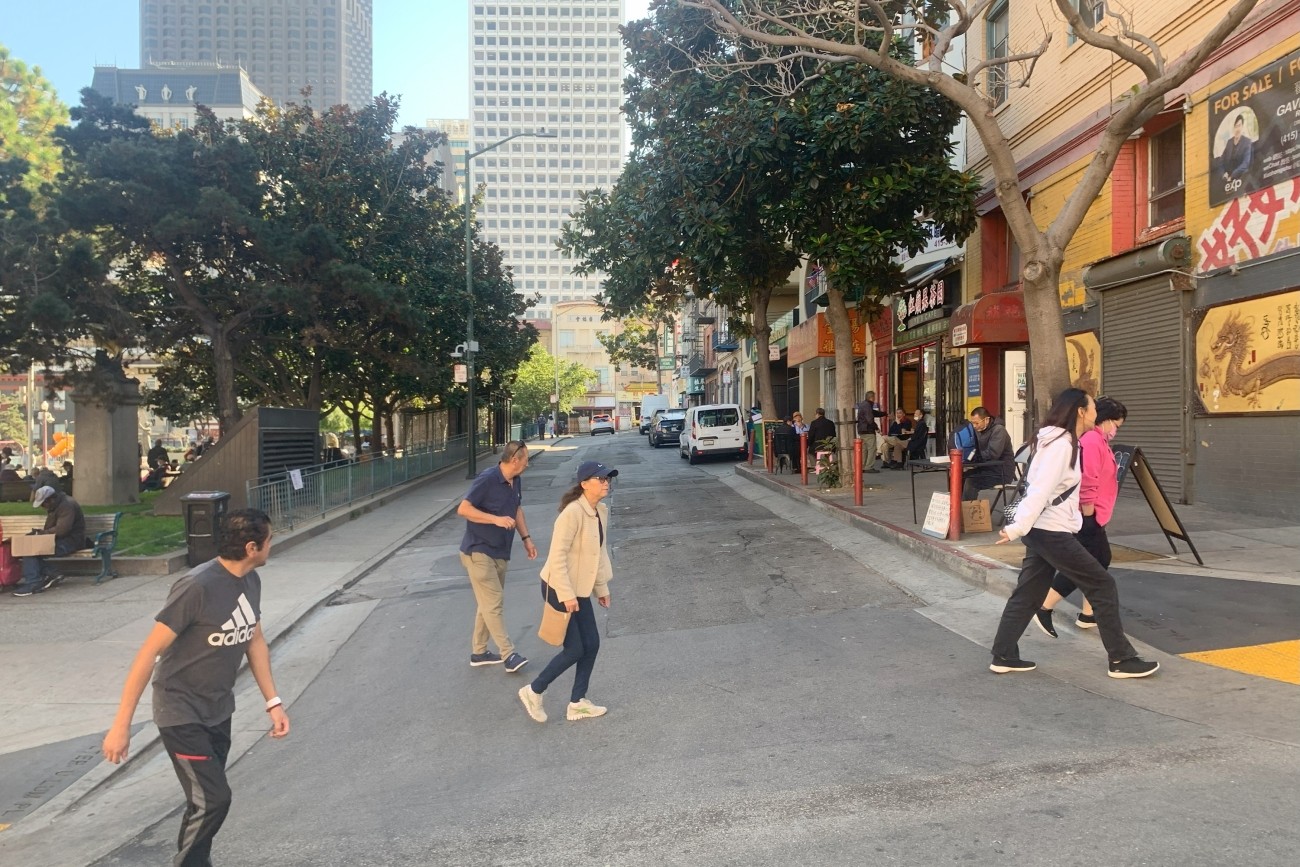
This study will examine various scenarios for a people-first Walter U Lum Place in District 3.
Image
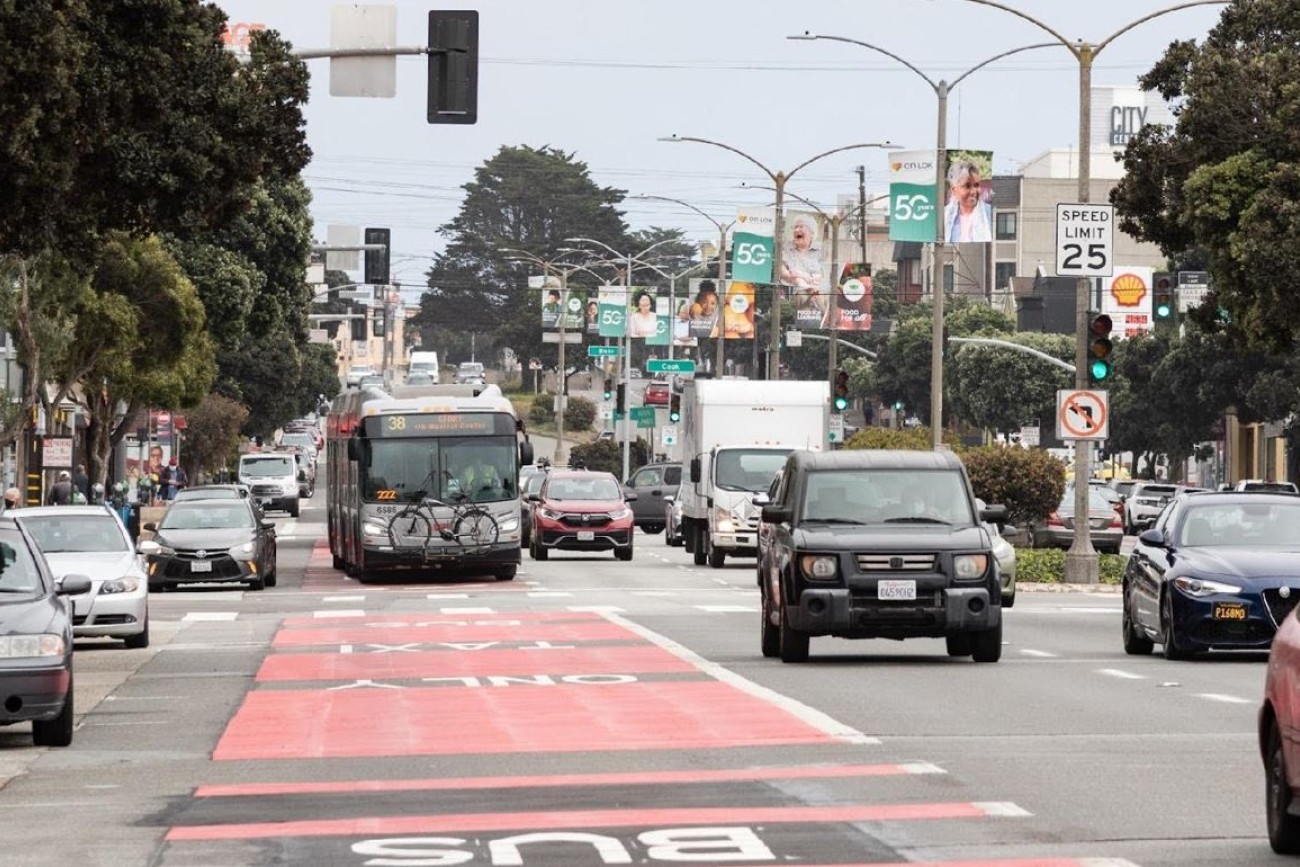
Geary Bus Rapid Transit will improve Geary Boulevard with much-needed safety improvements and faster, more reliable bus service for the tens of thousands of people who use the 38 Geary and 38R Geary Rapid bus routes every day. Project improvements include red bus-only lanes, signal priority for buses, and safety improvements such as sidewalk extensions and accessible curb ramps.
Image
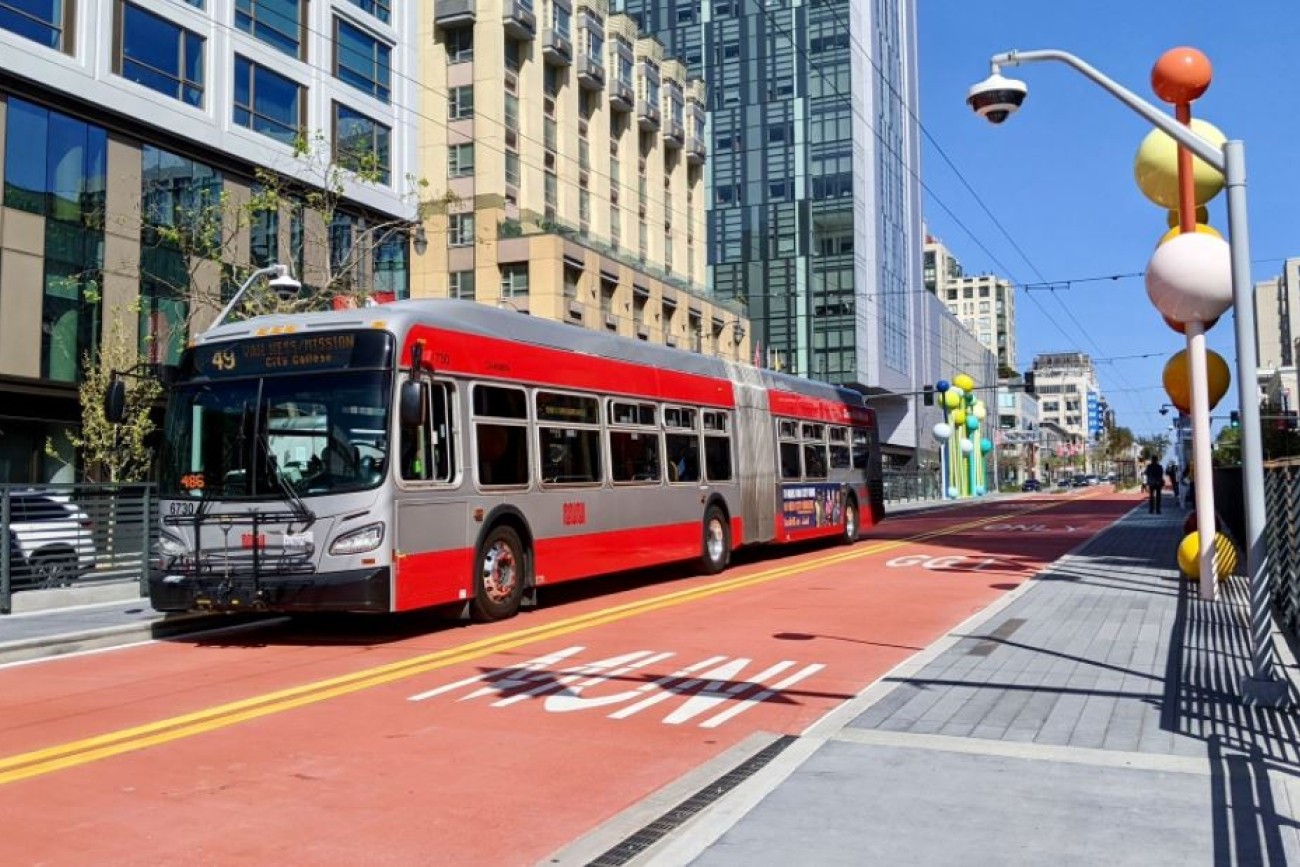
The Van Ness Improvement Project is bringing San Francisco its first Bus Rapid Transit system.
Image
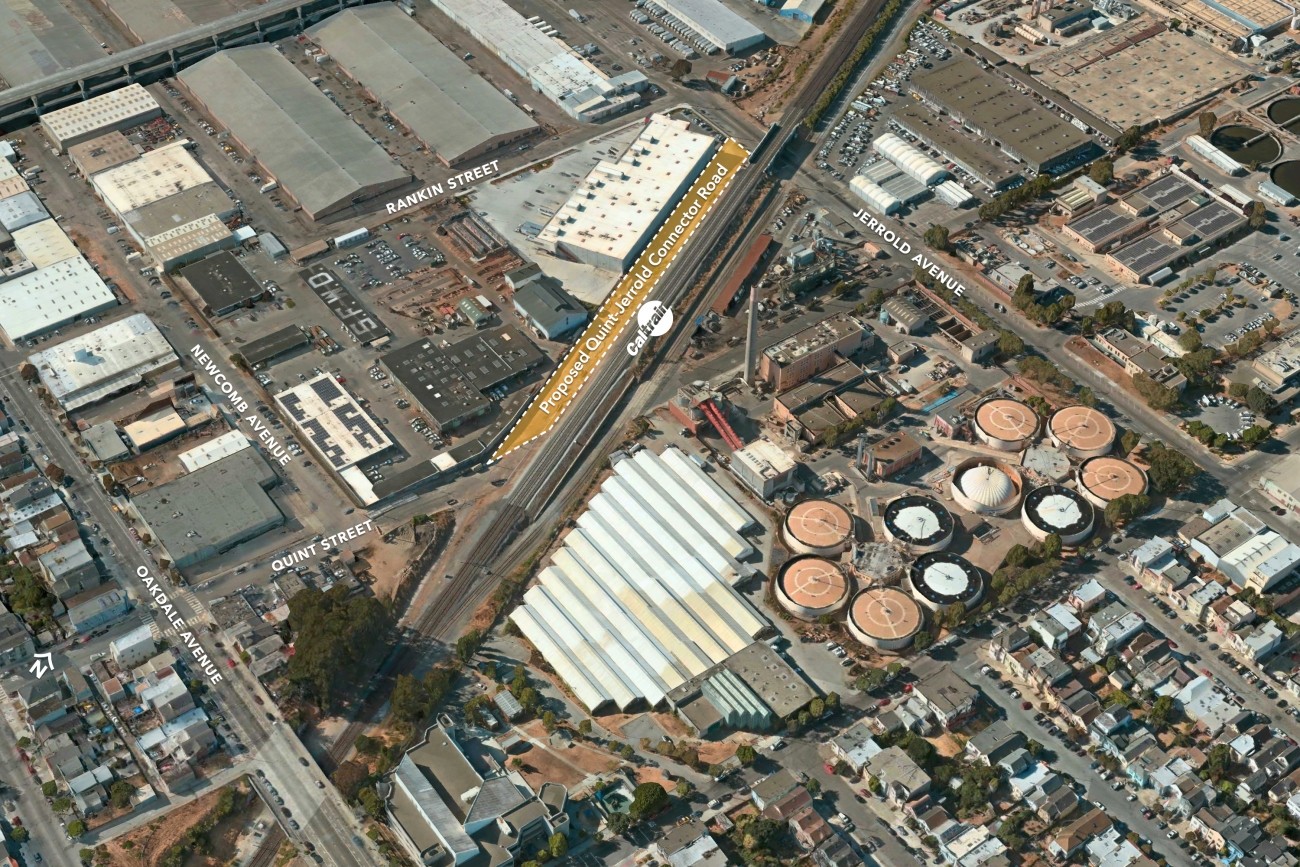
The proposed Quint-Jerrold Connector Road will reestablish a connection between Oakdale Avenue and Jerrold Avenue via a new road along the west side of the Caltrain tracks.